Gold Bubble? Demand Data Continues To Show No Bubble |
Date: Thursday, May 24, 2012
Author: GoldCore
Gold’s London AM fix this morning was USD 1,555.00, EUR 1,229.44, and GBP 989.56 per ounce. Yesterday's AM fix this morning was USD 1,575.75, EUR 1,233.95, and GBP 998.76 per ounce.
Gold fell $26.20 or 1.64% in New York yesterday and closed at $1,566.80/oz. Gold fell in Asia and those falls continued in Europe where gold has been trading in a $16 range.

Asset Class Performance Since Greek Election– Thomson Reuters
Gold edged down again this morning despite fears that the European Union's umpteenth meeting later today will not take clear steps to solve the area's debt debacle. Even more worrisome is the showdown that could ensue between Hollande and Merkel about mutualised European debt which could create new obstacles and delay any means of a quick solution.
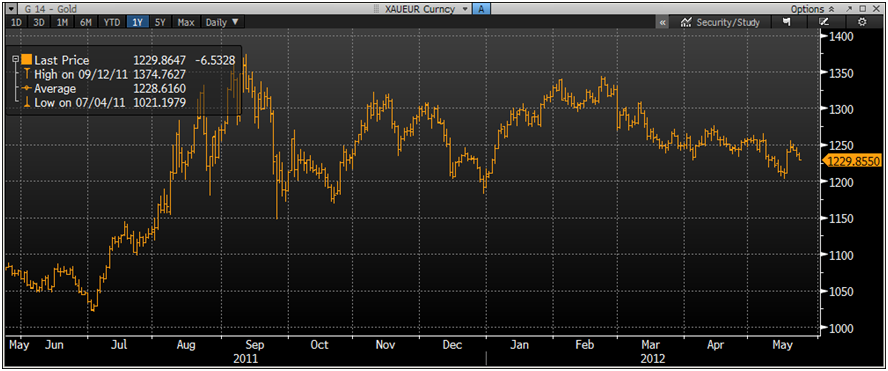
Gold hit $1,555.03 early in the day, its lowest level in nearly a week but gold in euro terms remains robust well above strong support at €1,200/oz.
Greece’s exiting the EU financial bloc and monetary union could see further short term gold weakness but is gold bullish and should lead to higher prices in the long term.
Meanwhile the euro is at a 4 month low against the dollar, and the dollar index is at its highest level since September 2010. This dollar strength is not sustainable due to the appalling fiscal and monetary situation in the U.S.
Since the Greek elections on May 6, just about every asset class has fallen in value.
With the exception of U.S. 10-year Treasuries, German 10-year Bunds (both up 1.2%) and the Dollar Index (up 2.5% against its basket of currencies), just about everything else has fallen and many quite sharply.
As has been seen in sudden and elevated risk off periods in recent years, gold has again fallen but importantly it has fallen by less than other riskier assets.
For the month of May, gold is down 6.4% in USD terms. While the S&P 500 is down 5.8% and the much touted tech stock, Facebook is down 30%.

XAU/EUR Currency 1 Year – (Bloomberg)
For euro investors, gold has again out performed risk assets and proved a safe haven, with euro gold down just 2.15% in May and still up 2% YTD. The euro gold chart looks particularly bullish with strong support at €1,200/oz.
The massive consolidation since September should provide the base and springboard to sharply higher prices in the coming months.
The CAC and the DAX are down 5.9% and 6.5% respectively. Periphery stock markets have fallen by as much if not more.
Greece’s Athex composite index is down more than 22% since the close of business on May 4, and almost all others -- including many you might have assumed to be immune to the euro zone crisis have slumped.
MSCI Asia ex-Japan down 8.5 percent, MSCI emerging equities down almost 9 percent.

XAU/GBP Currency Daily –( Bloomberg)
The FTSE is down 7.5% so far in May and down 5% YTD.
While gold in sterling is down by just 3.5% in May and 1.7% YTD.
This once again shows the importance of gold as a diversification in a portfolio.
Gold Bubble? Demand Data Continues To Show No Bubble - Dr. Constantin
Gurdgiev
Q1 2012 global gold demand figures were published last week and,
surprise, surprise, there has been some decline in investment components of
demand. Predictably. What is surprising, however, are the dynamics. For some
time now we've been hearing about the gold bubble and about recent price
moderations being the sign of the proverbial 'hard landing'. Sorry to disappoint
you, not yet.
Let's chart some data and discuss:
• Jewellery demand increased from 476 tons in Q4 2011 to 520 tons in Q1 2012 - a rise of 9.24% q/q, but a drop of 6.3% y/y. This contrasts price movements (see below). More significantly, peak Q1 jewellery demand was in Q1 2007 and Q1 2012 demand is only 8.1% below the peak level. Not the fall-off you'd expect were jewellery buyers exercising their option to stay away from higher priced gold.
• Technology-related demand came in at 108 tons in Q1 2012, up on 104 tons in Q4 2011 (+3.8%), but down 6.1% y/y/ Peak Q1 demand for technology gold was in Q1 2008 and Q1 2012 demand came in 11.5% below that. Again, no serious drama here - some substitution away from higher priced gold, but also much of the effect due to global slowdown in production of white goods and electronics, plus price moderation in substitutes on the back of a global economic slowdown and crises.
• Bar & Coin Investors' demand (more longer-term physical investment demand) was down from 356 tons in Q4 2011 to 338 tons in Q1 2012, a fall off of 5.06% q/q and 16.75% y/y - virtually in line with price movements, but in the opposite direction. Substitution and other factors (see below) suspected. Incidentally, Q1 2011 was also the peak quarter in total demand for Bar & Coin investors.
• ETFs - more volatile demand source - reduced their demand for gold to 51 tons in Q1 2012, down from 95 tons in Q4 2011. These funds tend to have exceptionally volatile net demand, including negative readings in some quarters.
Here's a handy table comparing demand levels by investment/use type as follows:
1. First I compute Q1 average demand for 2006-2011
2. Second I report by how many tons Q1 2012 demand was different from the above average:

Source: Author calculations based on Gold Council data (same for charts
below)
Conclusion out of the table: no drama. As expected - physical demand is still ahead of average, but moderating gradually. Jewellery demand is above average - a massive surprise for those who use this demand component to argue that decline in jewellery demand shows that gold is a bubble driven solely by investment objectives. Within investment gold: ETFs are becoming less relevant (more speculative component) while gold bars and coins (less speculative, more 'long-hold' component, especially on coins side) becoming more important.
To show decline in Jewellery and Technology (non-investment) gold relative role, here's a chart:
In Q1 2012, non-investment gold demand accounted for 61.8% of all demand (excluding Central Banks) - Q1 2006-2011 average share is 67.3%, which is above the current share. However, the current share is the highest since Q1 2011.
Now, end-of-quarter prices in USD: Q1 2012 ended with gold priced at USD 1,662.5/oz - the highest quarter-end price on record and up 8.6% on Q4 2011 and 15.53% on Q1 2011.
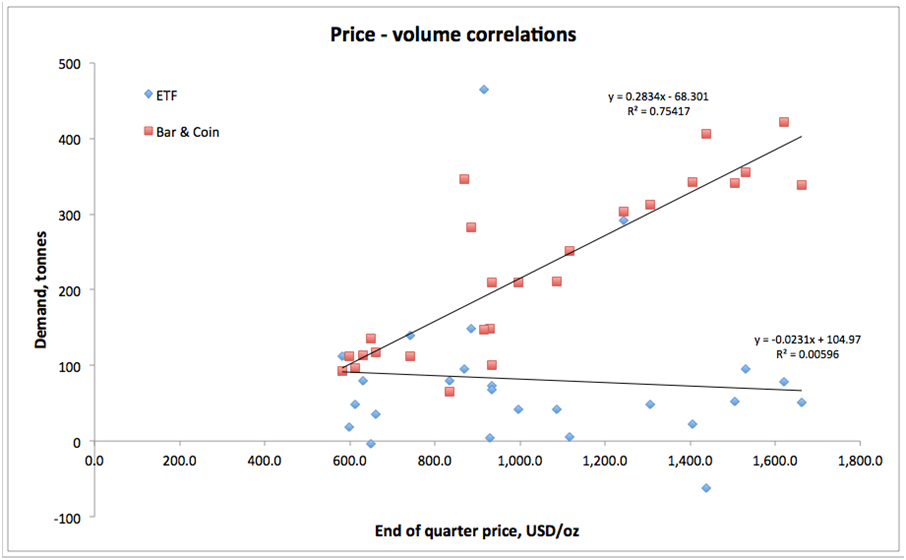
Next two charts plot relationship between price and volume demanded by specific category:
Notice the following:
1. There is a strong positive relationship between gold price and demand by gold bar & coin investors. Perverse? Not if you know that gold is an inflation / USD hedge.
2. Basically zero relationship to ETFs demand. Surprising? Not really - these are actively managed and not exactly risk-hedging entities (see below).
3. Weak negative relationship for physical non-investment demand (jewellery & technology) - suggesting some substitution effect, but not much of one. Which, in turn, implies that there is some other driver here - perhaps shorter term changes in demand for goods produced using gold and longer term technological change (think dental demand - when was the last time you fitted a gold tooth?)
4. Weak positive relationship between price and overall demand for gold. Funny thing is - if there's a bubble, you'd expect a much stronger relationship, don't you? After all, there would be hype of rapidly rising demand as prices rise?
So what is happening on the demand side of gold markets, then? Here are my views:
1. Dollar strengthening and oil price moderation are both signaling that gold price moderation should be impacting USD price more than other currencies-denominated prices. This is true, when you compare changes in USD price and Euro price;
2. ETFs are clearly suggesting a signal that some of the gold demand (primarily speculative component) is being drawn down during the 'risk-off' periods, like the one we are currently going through. Speculative demand is moderating significantly, which is good medium-term;
3. Tax changes on gold bullion in India had significant impact, including on jewellery-related gold demand from there;
Central banks demand pushes price-demand relationship out toward flatter slope and reduces price-elasticity of global demand.
Dr. Constantin Gurdgiev: Gold Demand In Q1 2012 (click to read research document)

Cross Currency Table – (Bloomberg)
OTHER NEWS
(Bloomberg) -- UBS Sees Gold Outperforming Copper Prices in the Coming
Months
Gold will outperform copper prices in the coming months, UBS AG said in a report
e-mailed today.
“We recommend a matched position long gold, short copper,” the bank said.
(Bloomberg) -- IShares Silver Trust Holdings Unchanged at 9,649 Metric
Tons
Silver holdings in the IShares Silver Trust, the biggest exchange-traded
fund backed by silver, were unchanged at 9,649.21 metric tons as of May 22,
according to figures on the company’s website.
================================================================================
May 22 May 21 May 18 May 17 May 16 May 15
2012 2012 2012 2012 2012 2012
================================================================================
Million Ounces 310.229 310.229 310.229 305.959 305.959 305.959
Daily change 0 0 4,269,979 0 0 0
--------------------------------------------------------------------------------
Metric tons 9,649.21 9,649.21 9,649.21 9,516.40 9,516.40 9,516.40
Daily change 0.00 0.00 132.81 0.00 0.00 0.00
================================================================================
NOTE: Ounces are troy ounces.
(PTI) -- Gold, silver imports more than double in last four years
Imports of gold and silver have soared to USD 61.5 billion in 2011-12, from USD
22.8 billion in 2008-09, the government said today.
"The value of imports of gold and silver was USD 22.8 billion in 2008-09, USD 29.6 billion in 2009-10, USD 42.5 billion in 2010-11 and USD 61.5 billion in 2011-12," Minister of State for Finance Namo Narain Meena said in a written reply to the Rajya Sabha.
As per the World Gold Council, India is the largest consumer of gold in the world followed by China, he added.
"As far as gold and silver are concerned, India is a net importer and the prices of these precious metals depend on international prices. The volatility in the prices of gold and silver in India is mainly due to the volatility in the prices of these commodities in the international markets," he said.
The current account deficit (CAD), which arises when import of goods and services exceeds export, had touched 4 per cent at the end of December 2011. It was 3.3 per cent during the same period of previous year.
The increase in CAD was mainly on account of higher imports of petroleum products and gold and silver.
In a separate reply, Meena said to lower the impact of gold import on CAD, the government in Budget for 2012-13 has proposed to increase basic customs duty on standard gold bars, gold coins of purity exceeding 99.5 per cent and platinum from 2 per cent to 4 per cent.
Besides, customs duty on non-standard gold was increased to 10 per cent from 5 per cent.
He said the Reserve Bank has taken certain prudential measures in respect of Non-banking financial companies (NBFCs) which are engaged in lending against gold jewellery to restrict loans against gold.
For breaking news and commentary on financial markets and gold, follow us on
Twitter.
NEWS
Gold slumps on scepticism of EU meeting - Reuters
Europe Stocks, Oil Slide On Debt Crisis Before EU Summit - Bloomberg
Hollande set for EU summit showdown with Merkel - Reuters
Gold ends lower for second session – Yahoo Finance
COMMENTARY
Dr. Constantin Gurdgiev: Gold Demand In Q1 2012 – True Economics
Does The Gold "Support Channel" Mean The Drop Is Over? – Zero Hedge
Turk: Important Chart Suggests Massive Move for Silver & Gold – King World News
Gold: The World’s Friend For 5,000 Years - Mineweb
How Facebook could destroy the U.S. economy - MarketWatch
Reproduction in whole or in part without permission is prohibited.


