Building a Do-It-Yourself ETF Hedge Fund |
Date: Tuesday, April 21, 2009
Author: Marc Gerstein, Seeking Alpha.com
Even now, despite the recent financial calamities, hedge funds continue to occupy a special and sometimes romanticized place in the hearts of many investors. A recent article explored how use of short and ultra-short ETFs, together with the Portfolio123.com ETF screener and backtester, can help us create what most would assume to be the purest kind of hedge fund portfolio, the kind that uses long-short strategies in an effort to make money regardless of market conditions. Actually, though, the workaday hedge fund world is much broader than that, containing so much strategic variety that we might view hedge funds, collectively at least, as funds that are able to invest in almost any thing almost any time, allowing the fund manager to pursue "alpha" anywhere it may be found. The approach presented here will follow this latter approach.
Hedge fund Replication
If you'd like to collect interesting reading material to take on a long flight, do a Google search on the phrase: hedge fund replication. You'll encounter something of a cottage industry of folks trying to achieve hedge fund-like returns without hedge fund-like fees, not by making the same investments hedge fund managers make, but instead, by using statistical methods to analyze the performance (return and volatility) of hedge funds. Then, using various quantitative models, the replicators try to build portfolios consisting of securities, often ETFs, whose performance characteristics collectively mimic those of the hedge funds.
This isn't just a pastime for academicians. Just recently, a new ETF was launched to do this very thing: IQ Hedge Multi-Strategy Tracker ETF (QAI). For what it's worth, QAI rose 0.7 percent since debuting on 3/25/09, versus 6.3 percent for the S&P 500. Realistically, though, one cannot form an opinion based on 15 days worth of trading history. Pre-launch backtesting results presented on the sponsor web site indicate annualized five-year returns of 5.22% for the ETF (or, rather, the custom index which the ETF passively tracks) versus minus 4.76% for the S&P 500.
But does replication really have substance, or is it a grand exercise in data mining? Looking strictly at the past, which is what we must necessarily do when we engage in any sort of quantitative analysis, it shouldn't be difficult for a facile data miner to collect securities whose historic risk-return characteristics, taken together, mimic those of a target benchmark. The big question, though, is whether the factors that caused the high correlation seen in the past are likely to be sustainable going forward.
To some degree, such issues overlay everything done by anybody who engages in any sort of rules-based investing. But there are different degrees.
If I try to replicate the performance of an Energy sector fund, I feel pretty confident in my ability to pick securities for which the historic correlations will persist in the future; all I need do is select securities whose prospects are tightly linked to the energy sector. I know the fundamental drivers of the benchmark I'm trying to mimic, so I can make thoughtful decisions regarding how to replicate its performance.
At the other extreme, suppose I have no information about the benchmark except its historical performance record. Perhaps if my statistical work is sufficiently sound, I'll wind up in similar securities. Or, perhaps not. Maybe I'd wind up using a collection of commodities to produce performance similar to that of a benchmark consisting of a combination of U.S. Treasuries and global currencies. Who knows?
Needless to say, Index IQ, the firm that launched QAI, is not going to reveal the details of its proprietary methodology, so we don't know exactly what they're doing. But based on the information it has released, it seems that they're somewhere in the non-coincide ("better") portion of the continuum. Ultimately, though, the question of the relationship between statistics and fundamentals is feeder for a never-ending debate that will lead reasonable minds to differ.
Hedge fund imitation
Imitation involves looking for the kinds of assets hedge fund managers seek, and allowing the performance to take care of itself.
And what is it that hedge fund managers seek? The short answer: alpha (a level of return that, statistically speaking, is above what one might have expected given the amount of risk the fund manager assumed). They don't always achieve the alpha they seek because risk and reward expectations, no matter how sophisticated the models upon which they are based, often don't pan out. (Just ask anyone who, in recent years, tried to model anything relating to finance!) But that, at least, is the goal.
I'm not sure we need to cope right now with all the details of the calculation of alpha. Practically speaking, if we can consistently find our way into investments that produce better returns, relative to risk than is the case for the market, chances are we'll be satisfied with the ultimate outcome, especially if an ETF-based do-it-yourself approach spares us the burden of high hedge fund fees and keeps us away from illiquid investments that sometimes plague hedge funds.
Building a risk-reward balanced portfolio
For starters, I'm going to create a screen on Portfolio123 that imposes some practical constraints on my default All-ETFs universe. I'll eliminate HOLDRs, since they can only be traded in blocks of 100 shares. I'm also going to confine myself to the standard-long style; in other words, leveraged and short ETFs are out (their use was chronicled in another article) as are ETFs based on quant modeling (such as PowerShares Intellidex offerings) or special weighting protocols (e.g. Wisdom Tree). For what I'm trying to do, I think it might be overkill to pile rules-based modeling on top of rules-based models. I'm also going to knock out municipal bond ETFs since I'm aiming at a generic tax situation. Finally, I'll limit the universe to ETFs whose average trading volume over the most recent 20-day period was at least 5,000 shares per day. (A do-it-yourselfer has this luxury. A full-fledged hedge fund would probably have to set a higher volume threshold.)
As for the risk-reward balance, I'll start by keeping it as simple as possible, limiting myself to a simplified version of the Sharpe ratio: the annualized average weekly return divided by the annualized standard deviation of the weekly returns. (A true Sharpe ratio would use only that portion of the return that exceeds the risk-free rate.) I created an ETF ranking system on Portfolio123 based on:
- Sharpe calculated over the course of 1 year
- Sharpe calculated over the course of 2 years
These two factors are equally weighted.
I backtested a portfolio consisting of the top 20 ETFs from 3/31/01 through 4/16/09. The test assumed 4-week rebalancing intervals and price slippage of 0.25% per transaction. Figure 1 shows the result.
Figure 1
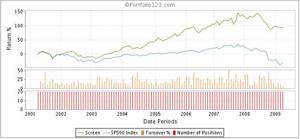
The results don't differ meaningfully if I substitute or add the modified versions Sortino ratios (where return, without adjusting for the risk-free rate, is compared only to downside deviation).
The five-year annualized return using just the Sharpe-like ratios was 7.9% versus minus 5.3% for the S&P 500. This isn't exactly apples-to-apples with the results of the QAI statistical hedge fund replication ETF since I don't have the exact start and end dates used in their test. But I think it's reasonable to suggest that this simple Portfolio123 ETF rank-and-screen can deliver investment results that are generally comparable to those achieved by a more mathematically sophisticated hedge fund replication model.
Table 1 lists the holding in such a 20-ETF portfolio as of now.
Table 1
iShares Barclays Aggregate Bond (AGG) |
There are two currency ETFs. Otherwise, the list reads like a who's-who among fixed income ETFs. And considering the equity markets' gyrations over the past couple of years, this should not come as a surprise. (Prior to 2008, the lists were much more equity-heavy, partially because there were fewer fixed-income ETFs to choose from, but also because of market conditions.) Commodities, too, have had enough ups and downs to depress one- and two-year Sharpe-type ratios. Interestingly, the QAI statistical replication ETF was about 70 percent invested in fixed income ETFs as of 4/6/09, although not the exact same ones as those in Table 1.
Thinking about fundamentals
Statistically speaking, the model presented above seems perfectly fine. I'm sure quite a few investors (including hedge fund investors) would be happy if they could turn the clock back and take the performance depicted above.
Looking forward, though, I wonder . . .
We have been experiencing a once-in-a-generation financial disaster, and the model, with its measurement period stretching up to two years, beautifully captures the qualities investors should favor under such conditions.
As to the future, we may not yet be out of the woods. But it does seem to be getting easier to make a case for the proposition that the worst is over or almost over. If that's the case, building a portfolio based on rules that served us so well in the recent past may not produce great results.
So here's an alternative approach. The screen is the same but the rating system is different. This one sticks with the Sharpe-Sortino approach but shortens the measurement periods by computing on a daily basis over 20 and 60 trading-day periods. The model also looks for recent trends in these ratios. (It's available here as a pre-set Portfolio123 ranking system.)
- Sharpe calculated over the course of 20 trading days
- Monthly change in 20-day Sharpe
- Sharpe calculated over the course of 60 trading days
- Monthly change in 60-day Sharpe
- Sortino calculated over the course of 20 trading days
- Monthly change in 20-day Sortino
- Sharpe calculated over the course of 60 trading days
- Monthly change in 60-day Sharpe
These factors are all equally weighted.
The backtest for this approach, the results of which are illustrated in Figure 2, needs to be interpreted a bit flexibly. We know going in that this model is not likely to provide as much downside protection as what we experienced above. By limiting the Sharpe-Sortino look-back to 60 trading days (about three months) at most, I'm obviously going to be more exposed to ETFs that, over a one- or two-year period, experience more volatility. Here's the overall impact on performance.
Figure 2
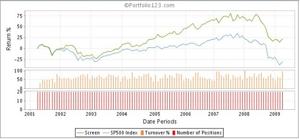
While the backtest result is still probably a lot better than what many investors experienced in the real world, it isn't as positive as what we saw in Figure 1. But the portfolio it produces, listed in Table 2, may be a lot more appealing for investors who believe the market is ready for a new upcycle.
Table 2
iShares Barclays 1-3 Year Credit Bond (CSJ) |
The second list is much more generously weighted in secondary (small- and mid-cap) U.S. equities along with some sector, currency and global offerings. And it looks like it really is targeting the U.S. Past equity-oriented lists had much greater international exposure than we see here. All in all, it's easy to see how such ETFs would be appealing if, indeed, we are about to enter a new market upcycle. Speaking for myself, my preference right now is for the second list.
Replication versus imitation
Hedge fund replication is all well and good. But I favor the approach demonstrated here (imitating hedge funds by seeking favorable balancing of risk and reward) and in my prior article discussing the market-timing long-short approach. The results here seem appealing (compare them with the various hedge fund replication results achieved by Index IQ). Moreover, here, we know what we're looking for and we can understand why the lists are showing the kinds of ETFs they show, thus facilitating more thoughtful tactical decisions (such as a choice between Table 1 and Table 2, or any other list one might come up with as a result of different variations in the Sharpe-Sortino theme).